


What is a normal blood sugar—and are the targets commonly given to people with type 2 diabetes actually the same thing?
In this episode, you’ll learn what normal fasting, post-meal and A1c levels really are, and why understanding the difference could have a meaningful impact on your long-term health.
LISTEN TO THE PODCAST
Support the podcast by leaving a 5-star rating and review on Apple, Spotify or our Website – Thank You!
What Is a Normal Blood Sugar and A1c? The Numbers You Need to Know
What is a normal blood sugar level?
It sounds like a simple question, but there is a surprising amount of confusion about the answer—especially if you have type 2 diabetes or prediabetes.
One major reason is that normal blood sugar levels and diabetes treatment targets are not the same thing. Understanding that difference can help you make better sense of your numbers and set meaningful goals for improving your health.
In this episode of the Type 2 Diabetes Talk podcast, you’ll learn what normal fasting blood sugar, post-meal blood sugar and A1c actually look like, why some commonly quoted numbers can be misleading, and what research tells us about blood sugar and your long-term health.
What Are Normal Blood Sugar Levels?
There are three important numbers to understand:
Fasting blood sugar: A normal fasting blood sugar is 70–99 mg/dL (4.0–5.5 mmol/L), although some guidelines use up to 6.0 mmol/L as the upper limit.
Two-hour post-meal blood sugar: A normal level is below 140 mg/dL (7.8 mmol/L).
A1c (HbA1c): A normal A1c is below 5.7% (39 mmol/mol).
These ranges describe glucose regulation in people without diabetes. If you have type 2 diabetes or prediabetes, moving your numbers closer to these normal ranges may be an important goal—provided it can be done safely.
Normal Blood Sugar vs Diabetes Treatment Targets
Here’s where things often become confusing.
You may have heard that a blood sugar below 180 mg/dL (10 mmol/L) two hours after eating is considered acceptable.
That number appears in diabetes treatment guidelines, but it does not mean 180 mg/dL is a normal post-meal blood sugar.
Instead, it is a treatment target used for many people who already have diabetes. Treatment goals take into account factors such as your age, medications, other health conditions and risk of hypoglycemia.
That distinction matters because your day-to-day blood sugar influences your overall A1c.
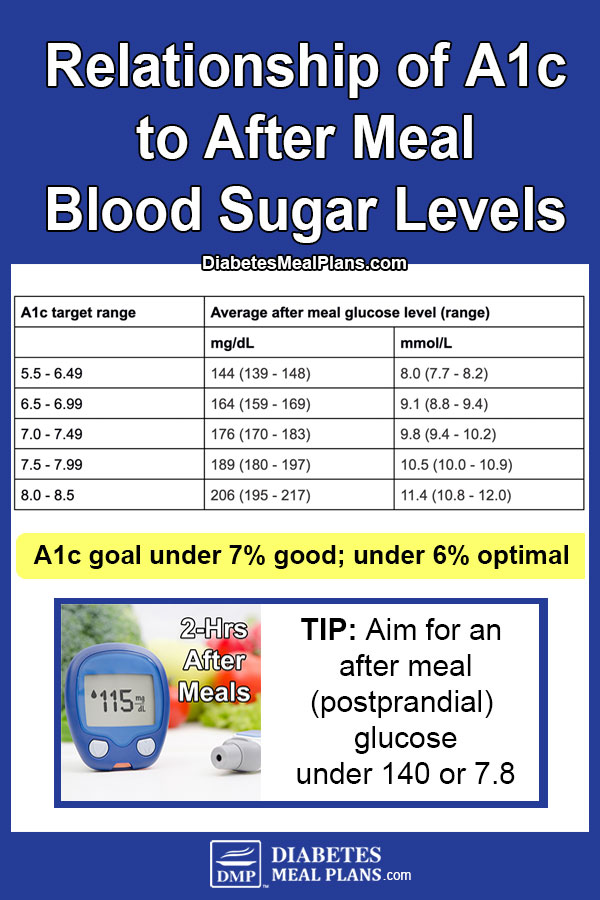
For example, an average blood sugar around 180 mg/dL (10 mmol/L) corresponds to an estimated A1c of approximately 8%. If your goal is an A1c below 7%, your average glucose generally needs to be considerably lower.




Why Lowering Your A1c Matters
Improving blood sugar isn’t simply about achieving a better number on your next blood test. It can help protect your long-term health.
Research has found that for every 1% reduction in A1c, there was an associated:
- 21% lower risk of diabetes-related death
- 14% lower risk of heart attack
- 37% lower risk of microvascular complications, including damage to the eyes, kidneys and nerves.
This is why improving your blood sugar control can be so worthwhile.
One Practical Step You Can Take
Start by getting familiar with your own numbers.
Look at your latest A1c, but also pay attention to your fasting and post-meal blood sugar if you monitor at home. Rather than viewing each reading as simply “good” or “bad,” use your numbers as information.
What happens after different meals? Are your fasting readings gradually improving? Is your A1c moving in the right direction?
You don’t need to achieve normal numbers overnight. Your appropriate target may also depend on your individual circumstances, medications and risk of hypoglycemia.
But if you can safely and sustainably move your blood sugar closer to the normal range, the evidence consistently suggests that better glucose control is associated with better long-term outcomes.
Transcript
Click Here To View
Hello wonderful people, Dr Jedha here and welcome to episode 127.
When I posted a short video on TikTok about normal blood sugar, I did not expect the firestorm of comments. Some asked questions because they still had confusions, some pushed back hard and argued I was wrong, some said their doctor told them something different, others claimed it was a conspiracy with big pharma lowering the numbers for profit. Let me tell you, it was all very interesting.
Before we get into all this I want to say a few thankyous. Firstly to those of you who left a 5-star rating on Apple, a big thanks. While you didn’t leave any review comment I appreciate your 5-star ratings, similarly a big thank you for leaving a rating on Spotify – all of these ratings really help the podcast, so I appreciate your support. And a special thanks to those who have left ratings and reviews on our website. Donna who shared that the podcast helped her lose 25 lbs – that’s awesome Donna, well done and so glad it’s helped you get results. Bill who shared that he was diagnosed with type 2 diabetes over a year ago and said he used the information from the show and after about 15mo I got my A1C down to 5.4, crediting the show for helping him get there – thanks Bill, that’s wonderful to hear you’ve reversed the trajectory of your health so early in your doagnosis and now have a handle on things. Jackie who said the podcast is so worth it. She said: “I’m going through the podcasts for a second time. Listening to ones I skipped over or reviewing ones I want more information. I do this while exercising. Well worth the listen.” I really appreciate that you’ve all taken the time to show your support by leaving a 5-star rating and review. If you’re a regular listener, please head to Type2DiabetesTalk.com/review to show your support for the podcast by leaving a 5-star rating and review.
Back to today’s topic…clearly, there is a lot of confusion out there about normal blood sugar and A1c levels, and this matters. Knowing what’s truly normal is the difference between protecting your long-term health or missing the warning signs. We have talked about numbers on the podcast before. In episode 11 we talked specifically about normal levels, episode 60 we recapped numbers and why blood sugar is so important, in episode 86 we talked about diagnostic criteria covering normal levels and when a diagnosis of prediabetes or type 2 diabetes is made. And across many other podcasts we have covered various numbers. But it’s never a bad thing to take a refresher. If newly diagnosed it helps explain the numbers, but even if you’ve been living with type 2 diabetes or prediabetes a while, it’s still important to take a refresher and have these normal numbers clear in your mind as a goal you might work toward.
Together today we’re going to go over the numbers, clear up the myths, explain what the science actually says, and answer your real questions about what normal blood sugar and A1c really is.
Before we get into the myths and misconceptions, let’s make sure we’re all talking about the same thing.
One of the biggest problems I saw in those TikTok comments was that people were using completely different definitions of the word “normal.” Some were talking about treatment targets for people living with diabetes, others were talking about what’s considered normal in someone without diabetes. Those are two very different things.
So let’s start with the basics.
There are three numbers I want you to know.
The first is your fasting blood sugar. This is the blood sugar level you measure first thing in the morning before you’ve eaten or had anything to drink apart from water. Most people measure this at home using a finger-prick glucose meter or a continuous glucose monitor, although it can also be measured with a laboratory blood test.
A normal fasting blood sugar is between 70 and 99 mg/dL, or 4.0 to 5.5 mmol/L. Now, depending on where you live, you may also see some guidelines use up to 6.0 mmol/L as the upper limit of normal. I’ll explain those differences shortly, but just be aware that different countries use slightly different cut-offs.
The second number is your post-meal, or postprandial, blood sugar. This is your blood sugar measured two hours after you start eating a meal. Again, you can measure this at home with a glucose meter or CGM.
A normal two-hour blood sugar is below 140 mg/DL, or below 7.8 mmol/L.
The third measurement is your hemoglobin A1c or HbA1c, often simply called your A1c. Unlike a finger-prick test, this is a laboratory blood test. Rather than telling you what your blood sugar is right now, it estimates your average blood sugar over the previous few months.
A normal A1c is below 5.7%, or below 39 millimoles per mole. In some countries you’ll occasionally hear people refer to under 6% or under 42 as being normal or ideal, but internationally, an A1c below 5.7% is the accepted threshold for normal glucose regulation.
Now I want to make one really important point.
These numbers come from people without diabetes. They represent normal human physiology.
For people living with prediabetes or type 2 diabetes, these are the numbers we ultimately want to move toward if they can be achieved safely. That doesn’t mean everyone gets there overnight, and it doesn’t mean everyone’s treatment plan is identical, but these are the normal ranges that research has consistently associated with the lowest long-term health risks.
And just a quick note before we continue—I’m talking here about adults who are not pregnant. Blood sugar targets during pregnancy and gestational diabetes are different, and that’s a separate topic, which we are not going to cover in this podcast.
So what happens when your numbers are above these normal ranges?
This is where we move into the diagnostic criteria for prediabetes and type 2 diabetes. We did a whole podcast on this in episode 86 but let’s briefly recap.
For fasting blood sugar, prediabetes is generally diagnosed between 100 and 125 mg/dL, or 5.6 to 6.9 mmol/L. A fasting blood sugar of 126 mg/dL, or 7.0 mmol or higher, is consistent with type 2 diabetes when confirmed appropriately.
For your two-hour post-meal blood sugar, prediabetes falls between 140 and 199 mg/dL, or 7.8 to 11.0 mmol. A reading of 200 mg/dL, or 11.1 mmol/ or higher, is in the diabetes range.
And for HbA1c, prediabetes is 5.7 to 6.4%, or 39 to 47 millimoles per mole. An A1c of 6.5%, or 48 millimoles per mole or higher, is consistent with type 2 diabetes.
So those are the numbers.
They’re not my opinion, they’re not social media opinions, and they’re not something that changes depending on who you ask. These ranges have been established through decades of medical research and are used around the world to diagnose diabetes and estimate future health risk.
Where the confusion begins is that treatment goals for someone already living with diabetes are sometimes very different from what’s considered physiologically normal. And that’s exactly where those TikTok comments went off the rails.
Move onto unpacking some of the misconceptions and confusion raised on TikTok.
Now, let’s come back to those TikTok comments.
Erik, John, Matt and quite a few others were convinced I was wrong. They all made slightly different arguments, but the message was essentially the same: that a normal blood sugar after eating can be anywhere from 70 to 180 mg/dL, or 4 to 10 mmol/L, and that as long as you’re somewhere within that range, you’re healthy—or that it simply depends on the individual.
And I completely understand why so many people believe that, because it’s what many people living with type 2 diabetes have been told.
Here’s where the confusion comes in.
A blood sugar of up to 180 mg/dL, or 10 mmol/L, is often quoted as an acceptable treatment target for some people with diabetes. It is not the definition of a normal blood sugar.
Those are two very different things.
Treatment targets are often designed to be realistic and safe, taking into account factors such as age, medications, risk of hypoglycemia and other health conditions. They are not intended to redefine what normal human physiology looks like.
And there’s another important point. Even as a treatment target, 180 mg/dL, or 10 mmol/L, isn’t necessarily where we want someone to stay long term if they can safely achieve better control. The evidence shows that, for most people, bringing blood sugar closer to the normal range reduces the risk of complications.
Now, you’ll see the 180 mg/dL or 10 mmol/L target referenced in medical guidelines, by diabetes organizations and by many healthcare professionals. So let’s have a look at what those guidelines actually say—because when you read them carefully, they tell a more complex story than many people realize.
So let’s start with the American Diabetes Association, or ADA. They’ve been publishing the Standards of Care in Diabetes for decades, and many diabetes organisations around the world base their own recommendations on these guidelines.
For most adults with type 2 diabetes, the ADA recommends aiming for an HbA1c below 7%, or 53 mmol/mol. They also recommend keeping your blood sugar below 180 mg/dL, or 10 mmol/L, two hours after eating.
Now, on the surface those numbers seem straightforward, but there’s something interesting when you look a little deeper. Elsewhere in the ADA guidelines, they include a table showing the relationship between average blood sugar and HbA1c. And this is where things become really important. If your average blood sugar were around 180 mg/dL, or 10 mmol/L, your estimated HbA1c would actually be around 8%, not under 7%. So, if your goal is to achieve an HbA1c below 7%, your average glucose needs to be much lower—around 154 mg/dL, or 8.6 mmol/L.
And if you’re aiming for an HbA1c in the normal range, somewhere in the 5% range or close to 6%, your average blood sugar needs to be lower again—around 126 mg/dL, or 7.0 mmol/L. This is why it’s so important not to confuse a maximum treatment target with an ideal blood sugar level. They’re not the same thing.
A post-meal reading of 180 mg/dL, or 10 mmol/L, is not what the evidence suggests you should routinely aim for if your goal is to achieve the lowest possible HbA1c and reduce your long-term risk of complications.
In fact, the ADA themselves discuss this. They highlight landmark studies, including the Kumamoto Study and the UK Prospective Diabetes Study, which found that lowering HbA1c even further—from 7% down to 6%, or 53 to 42 mmol/mol—was associated with additional reductions in the risk of microvascular complications, including damage to the eyes, kidneys and nerves. In other words, the evidence consistently shows that, when it can be achieved safely, lower is generally better.
The ADA also reinforced this in their 2021 international consensus report on type 2 diabetes remission. They defined remission as maintaining an HbA1c below 6.5%, or 48 mmol/mol, for at least three months without any glucose-lowering medication. Notice they didn’t define remission as staying under 180 or 10.0 after meals. The focus is on bringing overall glucose control back toward the non-diabetes range.
Now let’s compare that with another major organization—the American Association of Clinical Endocrinology, or AACE. Their recommendations are a little different.
Rather than simply recommending an HbA1c below 7%, AACE states that the optimal HbA1c target is below 6.5%, or 48 mmol/mol, and as close to normal as is safe and achievable.
I really like that wording because it acknowledges two important things. First, that everyone’s situation is different and targets should always be individualized. But second, if someone can safely achieve blood sugar levels closer to the normal range, that should be the goal.
AACE also explains what blood sugar levels are generally needed to reach that HbA1c target. They state that achieving an HbA1c below 6.5% may require a fasting blood sugar below 110 mg/dL, or 6.1 mmol/L, and a two-hour post-meal blood sugar below 140 mg/dL, or 7.8 mmol/L.
Notice that’s quite different from simply saying that anything under 180 mg/dL, or 10 mmol/L, is fine after meals. And it lines up perfectly with what we just saw in the ADA’s own average glucose data. If your goal is a healthier HbA1c, your day-to-day blood sugar generally needs to stay much closer to the normal range than to 180 or 10 after meals.
AACE also explains why these targets matter. They state that “the impact of tight glycemic control for the prevention and/or decreased progression of complications of type 2 diabetes is well established.”
In other words, this isn’t about chasing perfect numbers for the sake of it. It’s about reducing your risk of complications over the long term. Once again, we see the same consistent message: when it can be achieved safely, bringing blood sugar closer to the normal range offers greater protection against the complications of diabetes.
Before we move on to consider some more evidence, let’s hear a testimonial from one of our members.
Protection against the complications of diabetes isn’t a new idea. We’ve had strong evidence for decades showing that lowering HbA1c reduces the risk of diabetes complications. One of the landmark studies was published by Stratton and colleagues in 2000, using data from the UK Prospective Diabetes Study. The findings were remarkable.
For every 1% reduction in HbA1c, the risk of diabetes-related death fell by 21%. The risk of heart attack fell by 14%. And the risk of microvascular complications—that’s damage to the eyes, kidneys and nerves—fell by 37%.
Just think about that for a moment. Dropping your HbA1c from 8% to 7%, or from 7% to 6%, isn’t just improving a number on a pathology report. It’s associated with meaningful reductions in the risk of serious long-term complications.
That’s why organizations like the ADA and AACE place so much emphasis on improving blood sugar control. The goal isn’t to chase perfect numbers—it’s to protect your long-term health.
There’s also some interesting observational research that looked at the relationship between HbA1c and cardiovascular outcomes in people with type 2 diabetes. The researchers found that the lowest risk of heart attack occurred in people with HbA1c levels between 5.4% and 6.0%. For stroke, the lowest risk was seen between 5.7% and 6.5%.
They also found that people with HbA1c levels between 7.0% and 7.4% had a 13% higher risk of heart attack and an 8% higher risk of stroke compared with those whose HbA1c was below 7%. Again, we see the same pattern emerging. The closer blood sugar is to the normal range, the lower the risk of complications.
Now, does everyone need to achieve an HbA1c in the 5% range? No. There are always individual factors to consider, including age, other medical conditions, medications and the risk of hypoglycemia. But if you’re able to safely lower your HbA1c, the evidence consistently shows that doing so is associated with better long-term outcomes. And this brings us back to the original claim that a post-meal blood sugar of 180 mg/dL, or 10 mmol/L, is somehow “normal.” It isn’t.
It’s a treatment ceiling used in some diabetes guidelines—not a definition of normal physiology, and not necessarily the level that will help most people achieve the healthiest possible A1c. If your goal is to reduce your long-term risk of complications, the evidence we’ve looked at today points in the same direction: aim for blood sugar levels as close to the normal range as can be achieved safely and sustainably.
So we’ve established what normal blood sugar actually is, and we’ve seen that bringing blood sugar closer to normal, when it can be achieved safely, is associated with better long-term health. But there are still a lot of questions left unanswered. What if you’re living with prediabetes? Should your targets be different? What if you’re insulin resistant? What if normal numbers make you feel shaky? What about your age, do levels change? And what about all those comments saying ‘everyone’s normal is different’? That’s exactly what we’ll tackle in part 2 of this discussion.
For now, take care.
Dr Jedha, over and out.

Subscribe to Type 2 Diabetes Talk on: Apple | Spotify | Amazon Music | Audible | YouTube | Podcast Index | Player FM | and more…
Leave a Reply