


Table of Contents[Hide][Show]
- What Is a Continuous Glucose Monitor?
- What Is Continuous Glucose Monitoring?
- The CGM Blood Sugar Delay
- How Accurate Are CGMs?
- The Real Power of a CGM
- What Should Your Blood Sugar Be After Meals?
- What Is CGM Time in Range?
- When CGMs Create Confusion
- The Danger of Chasing Every Number
- Understanding the CGM Bigger Picture
- How We Recommend Using a CGM
- A CGM Can Show You What’s Happening. Your Nutrition Plan Determines What Happens Next.
Continuous glucose monitors (CGMs) have become one of the most popular tools for people with prediabetes and type 2 diabetes.
They offer something that traditional blood sugar monitoring cannot: a real-time window into what is happening with your blood sugar throughout the day and night.
For many people, seeing their blood sugar patterns can be eye-opening. Others quickly discover that using a CGM can become confusing, frustrating, or even anxiety-provoking when they don’t fully understand what the numbers mean.
People find themselves wondering why their glucose changed, whether a particular number is “good” or “bad,” and whether they should be concerned about every blood sugar spike or dip.
So how does a continuous glucose monitor actually work? How accurate is it? And how can you use the information without becoming obsessed with every little fluctuation?
Let’s explore.
What Is a Continuous Glucose Monitor?
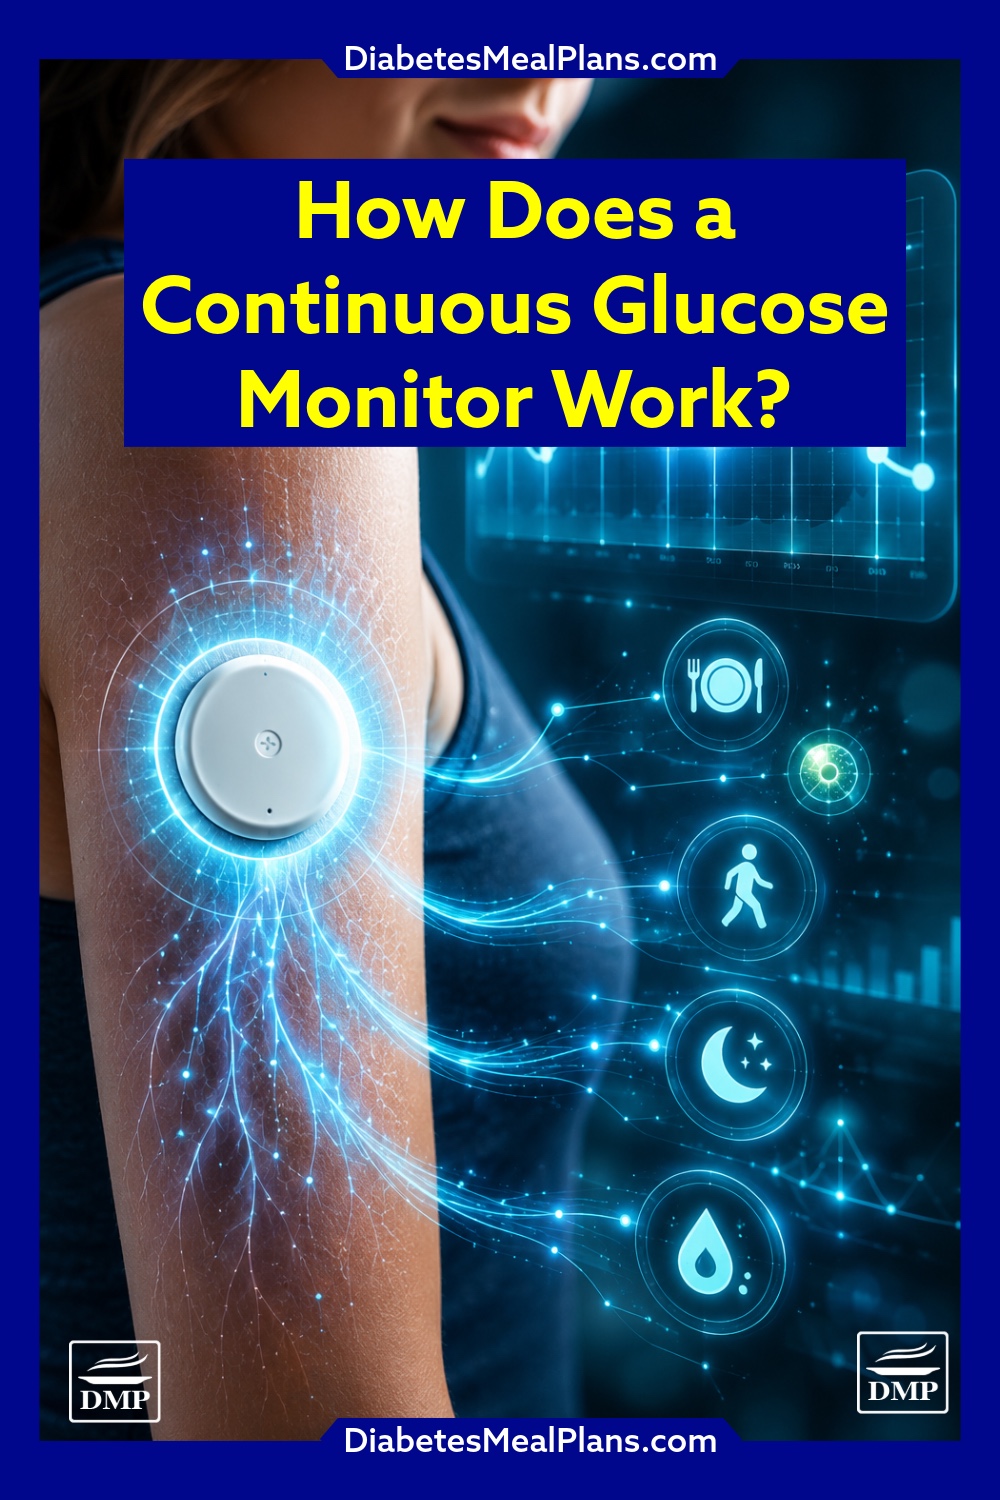
A continuous glucose monitor, otherwise known as a CGM, is a small wearable device that measures glucose levels throughout the day and night.
Most CGMs consist of a tiny sensor inserted just under the skin, a transmitter that sends information, and a smartphone app or receiver that displays the readings.
Unlike a finger-prick glucose meter, which provides a single reading at one point in time, a CGM measures glucose continuously, often every 1 to 5 minutes. This can result in hundreds of glucose readings every day.
No wonder the results can become confusing!




What Is Continuous Glucose Monitoring?
One of the most common misunderstandings is that a CGM measures blood sugar directly. It doesn’t.
Instead, the sensor sits in what’s called ‘the interstitial fluid,’ which is the fluid that surrounds your body’s cells.
Glucose moves from the bloodstream into this fluid, and the sensor measures glucose levels in the interstitial fluid, then uses sophisticated algorithms to estimate your blood glucose level.
This is why CGM readings can sometimes differ from a finger-prick test. They’re measuring related but slightly different things.
The CGM Blood Sugar Delay
Because glucose must first move from the bloodstream into the interstitial fluid, CGMs typically run about 5 to 15 minutes behind your actual blood glucose level.
This delay becomes most noticeable when glucose levels are changing rapidly, such as after eating, during exercise, or following treatment for a low blood sugar episode.
For example, if you eat a meal and your blood sugar rises quickly, a finger-prick reading may show the increase sooner than your CGM. Likewise, if your glucose is dropping rapidly during exercise, the CGM may lag behind what is actually happening in your bloodstream.
This lag is completely normal and is one reason why a finger-prick test may occasionally show a different result.
How Accurate Are CGMs?
Modern CGMs are remarkably accurate. Researchers often assess accuracy using a measurement called Mean Absolute Relative Difference (MARD), where lower numbers indicate better accuracy.
Most current CGMs achieve MARD values between 8% and 10%, which is considered highly accurate for day-to-day diabetes management. However, no glucose monitoring device is perfect.
Even finger-prick meters approved for home use are generally allowed to vary by approximately 15% from laboratory values. This means that small differences between readings are normal and expected.
If your CGM reads 125 mg/dL (6.9 mmol/L) and your finger-prick meter reads 135 mg/dL (7.5 mmol/L), this does not necessarily mean either device is wrong. The most important thing is not the exact number at a single point in time, but the overall trends and patterns.
The Real Power of a CGM
Many people assume the main purpose of a CGM is to obtain perfect glucose readings. In reality, the greatest value comes from identifying patterns.
A single reading tells you almost nothing. A pattern tells you everything.
For example, a CGM can help you discover which foods cause the biggest glucose rises, whether your breakfast is working for you, how your blood sugar behaves overnight, whether walking after meals lowers your glucose, how stress affects your numbers, and whether your fasting glucose is improving over time.
This pattern recognition can help you make more informed decisions about food, activity, sleep, and lifestyle.
Many members are surprised by what they learn. Some discover that foods marketed as “healthy” cause larger-than-expected glucose rises.
Others find that a simple walk after dinner significantly improves their glucose levels, which is something that is difficult to see from occasional finger-prick testing alone.
What Should Your Blood Sugar Be After Meals?
One of the most common questions we receive from members is: what should my glucose actually be after eating?
For people with prediabetes or type 2 diabetes, the after meal blood sugar target is less than 140 mg/dL (7.8 mmol/L) at 2 hours after the start of a meal.
This target aligns with what is considered a normal glucose response and is often used in diabetes research and clinical practice. The reason we focus on the 2-hour mark is because it reflects how effectively your body is handling the glucose from a meal.
It is important to remember that glucose levels will naturally rise after meals. The goal is not to prevent any rise at all.
For example, starting a meal at 95 mg/dL (5.3 mmol/L), rising to 125 mg/dL (6.9 mmol/L) at one hour, then returning to 115 mg/dL (6.4 mmol/L) at two hours would generally be considered an excellent response.
Even an occasional reading above 140 mg/dL (7.8 mmol/L) is not necessarily a cause for concern, just something to monitor and assess. Factors such as meal composition, portion size, sleep quality, stress, illness, and physical activity can all influence post-meal glucose levels.
What matters most is the overall pattern. If most meals consistently keep your glucose below 140 mg/dL (7.8 mmol/L) at the 2-hour mark, you are generally moving in the right direction.
What Is CGM Time in Range?
Another valuable metric provided by most CGMs is something called Time in Range (TIR). Time in Range measures the percentage of time your glucose remains within a target range over a 24-hour period.
For many people with diabetes, the standard target range is 70 to 180 mg/dL (3.9 to 10.0 mmol/L). However, for people working to improve blood sugar control through nutrition and lifestyle, it is better for many people to use tighter targets.
Many DMP members aim for fasting glucose below 100 mg/dL (5.6 mmol/L) and two-hour post-meal glucose below 140 mg/dL (7.8 mmol/L).
Time in Range provides a much broader picture than a single glucose reading. Imagine two people who both wake up with a glucose level of 110 mg/dL (6.1 mmol/L). Person A spends 95% of the day within their target range. Person B spends only 60% of the day within their target range. Those are very different metabolic health profiles.
Research has shown that higher Time in Range is associated with lower A1c levels and reduced risk of diabetes-related complications.
Many experts suggest aiming for greater than 70% Time in Range for people with diabetes, though many DMP members achieve substantially higher percentages as blood sugar control improves.
Rather than focusing on every individual spike or dip, Time in Range allows you to step back and assess the bigger picture. It answers the question: how much of the day am I spending in a healthy glucose range?
That is often far more useful than worrying about a single reading.
When CGMs Create Confusion
At DMP, we’ve seen many members gain valuable insights from CGMs. We’ve also seen some people become overwhelmed by the constant stream of data.
One member discovered that a particular gluten-free rice product caused significant blood sugar spikes despite being marketed as a healthy choice. Another noticed prolonged elevations after certain restaurant meals. These are useful discoveries.
However, we’ve also seen people become concerned when their glucose rises from 95 mg/dL (5.3 mmol/L) to 115 mg/dL (6.4 mmol/L) after a meal, or when a single spike appears that quickly returns to normal. This is where understanding physiology becomes important.
Blood sugar is supposed to rise after eating. That is a normal biological response. The goal is not a perfectly flat line, the goal is healthy glucose regulation.
Even people without diabetes experience blood sugar fluctuations throughout the day.
The Danger of Chasing Every Number
One of the biggest mistakes we see is people reacting emotionally to every reading. A CGM can sometimes create the illusion that every glucose movement requires action. It doesn’t.
When people constantly check their app, they may start obsessing over small fluctuations, avoiding otherwise nutritious foods, feeling anxious after every meal, making unnecessary dietary restrictions, and judging success based on individual readings. This can become mentally exhausting.
Instead of focusing on individual numbers, focus on trends.
Ask yourself: is my fasting glucose improving? Are my post-meal spikes becoming smaller? Is my Time in Range increasing? Is my A1c improving over weeks and months?
These questions are far more meaningful than whether one reading was 102 mg/dL (5.7 mmol/L) or 112 mg/dL (6.2 mmol/L).
And if your numbers aren’t shifting the way you expected, consider joining us as a member so we can help you achieve your goals.
Understanding the CGM Bigger Picture
A CGM is just one piece of the puzzle. Blood sugar is influenced by numerous factors, including food choices, portion sizes, sleep quality, stress and cortisol, illness, physical activity, medications, and hormonal changes.
Sometimes people become frustrated when they eat exactly the same meal on two different days and receive different glucose responses. This is entirely normal. Your body is not a laboratory experiment. It is a complex biological system responding to many different influences simultaneously.
Understanding insulin sensitivity and what drives it is one of the most important pieces of this puzzle. The better your insulin sensitivity, the more consistently your body will handle glucose from meals.
How We Recommend Using a CGM
At DMP, we encourage members to view a CGM as an educational tool rather than a report card.
Use it to learn. Use it to identify patterns. Use it to test ideas. But don’t let it dominate your day.
Some of the most valuable questions a CGM can answer include:
- What happens when I eat this food?
- What happens if I go for a walk after dinner?
- Does poor sleep affect my morning glucose?
- Are my glucose levels improving month to month?
When used this way, a CGM becomes a powerful source of feedback and motivation to help you improve your health.
A CGM Can Show You What’s Happening. Your Nutrition Plan Determines What Happens Next.
Continuous glucose monitors provide an unprecedented look at how your body responds to food, exercise, stress, sleep, and daily habits. The true value of a CGM isn’t found in individual numbers. It’s found in the patterns those numbers reveal.
Used wisely, a CGM can help you identify foods that work for you, understand your post-meal responses, improve Time in Range, and track your progress over time.
But many people quickly discover that seeing the numbers is only half the battle. The real challenge is understanding what those numbers mean and knowing exactly what changes to make.
Inside the DMP Membership, you’ll learn how to interpret blood sugar patterns, improve post-meal glucose levels, lower fasting blood sugar, improve A1c, and build a practical nutrition and lifestyle approach that delivers lasting results.
Learn More About the DMP Membership →

Leave a Reply